Topography Defines the True Impact of Sea Level Rise
Oct 7, 2025 @ 13:12
- by Premkumar SIntroduction — Turning Elevation into Insight
Sea-level rise (SLR) is not uniform; its impacts depend on how the ground beneath our feet is shaped. AssetRx physical-risk profiling platform, combines Digital Elevation Models (DEM), hydrodynamic SLR projections, and inundation analytics to reveal where and how risk evolves across coastal landscapes.
Data sources & methods
- Elevation data: 3m DEM (NAVD88) derived from LiDAR through NOAA.
- SLR scenarios: NOAA Intermediate-High projections for 2030, 2050, 2090.
- Processing engine: AssetRx computes AI-powered inundation depth, exposed area, and temporal progression using complex raster analytics.
Objective of the study
To demonstrate how topographic variation controls the pace and pattern of inundation and how AssetRx converts these spatial-temporal datasets into hidden, decision-ready insights for climate-risk evaluation, adaptation planning, and asset resilience.
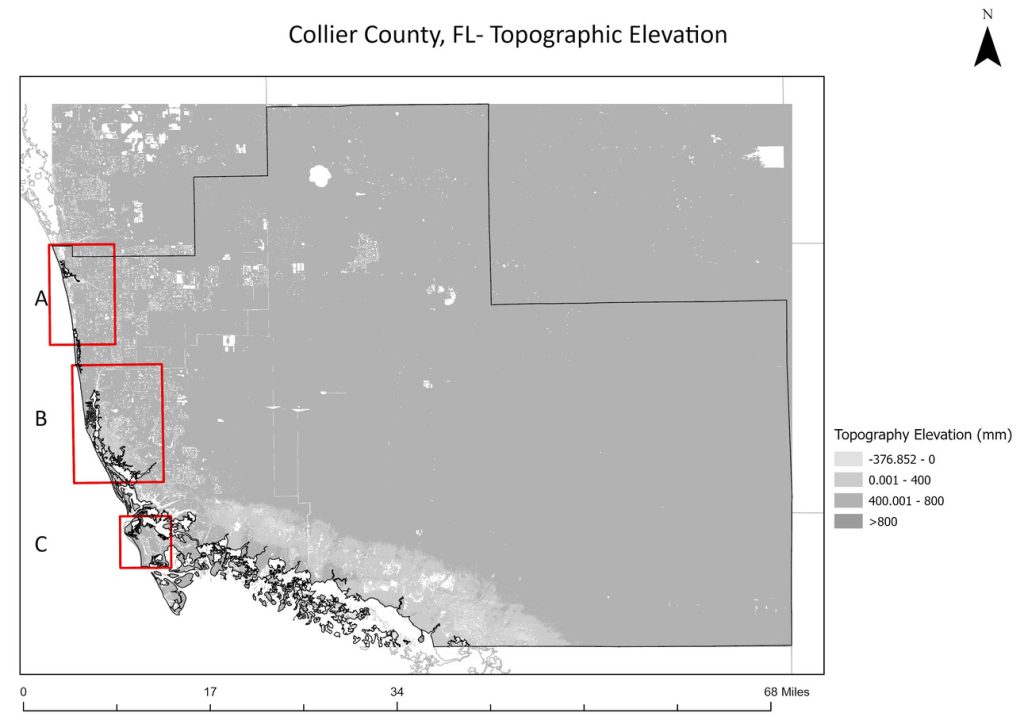
Terrain as Destiny — Elevation Profiles of the Study Areas
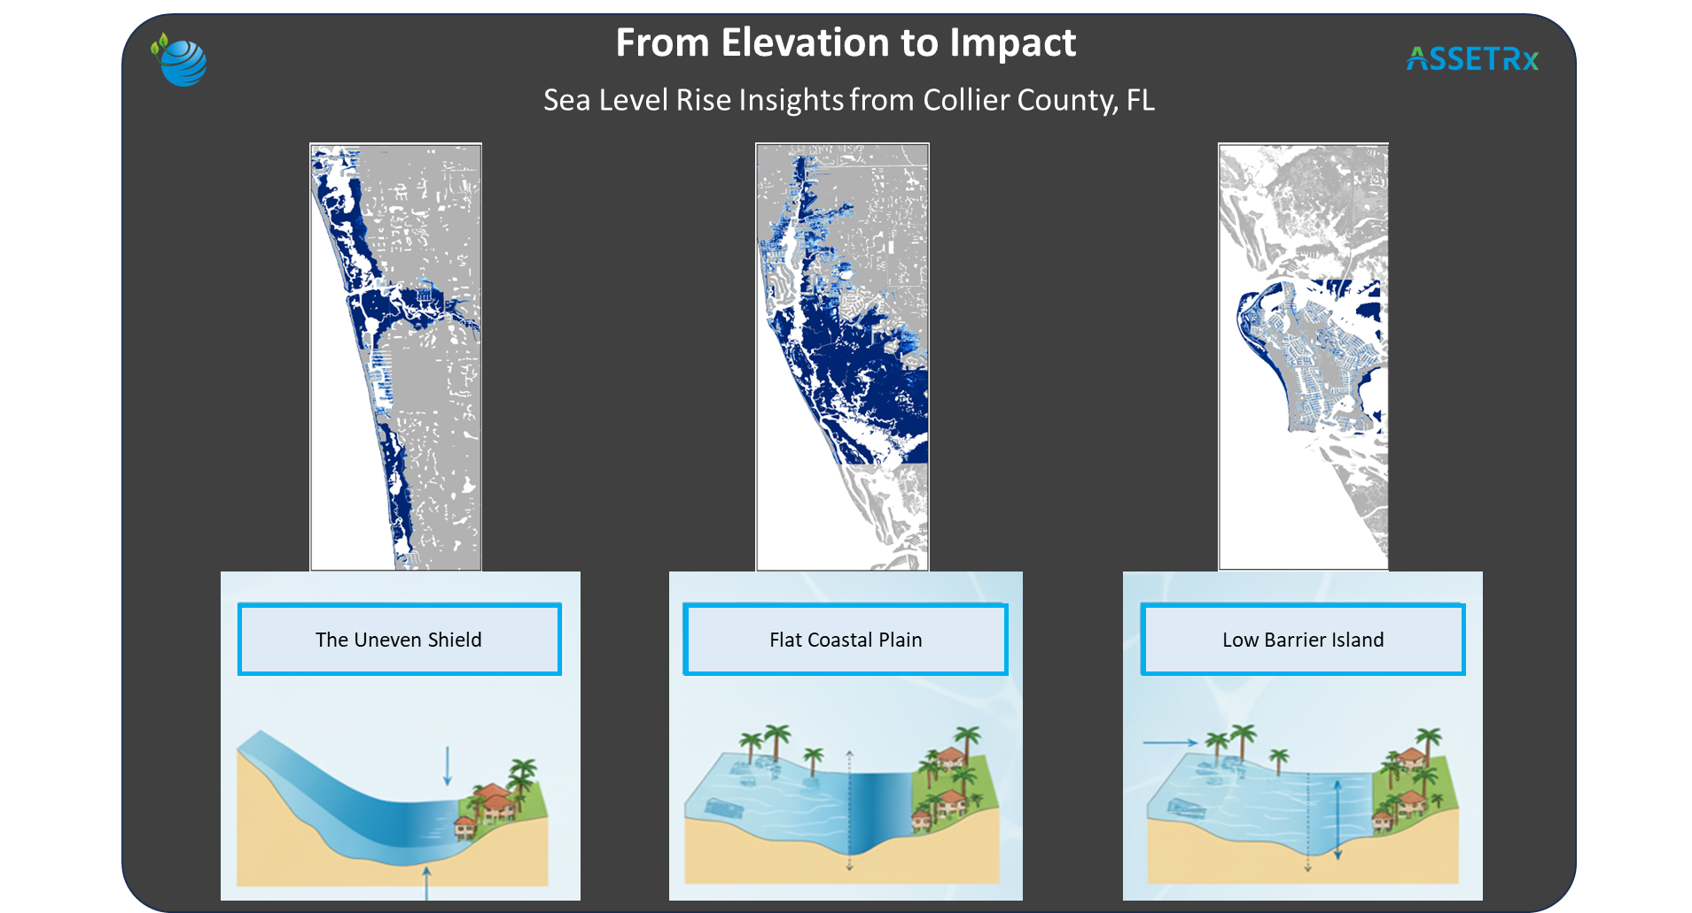
To capture the full spectrum of Collier County’s coastal behavior under rising sea levels, three study areas were deliberately chosen to represent distinct elevation and geomorphic conditions. Each area illustrates a unique interaction between terrain form and inundation dynamics, allowing AssetRx to demonstrate how subtle topographic differences can reshape the scale and pace of flooding.
| Study Area | Barefoot Beach & Naples Beach | Aqua Lane Shores & Royal Harbor | (C) Marco Island |
| Topographic Character | The Uneven Shield | Flat Coastal Plain | Low Barrier Island |
| Mean Elevation | 3.13m | 1.72m | 1.70M |
| Elevation Range | –0.38m to 11.96m | –0.37m to 16.13m | –0.34 – 15.49 |
| % Area < 4 m Elevation | 80 % | 97% | 93% |
| Key Topographic Traits | Variable slopes create patchy vulnerability | Gently sloping plain prone to broad flooding | Engineered terrain, minimal natural buffer |
Study Area – Topographic and SLR Profiling
Here we are talking about each area’s topography with its AssetRx-generated Sea Level Rise (SLR) profile to show how terrain dictates inundation behavior. By combining elevation data with SLR analytics, we reveal how slope, relief, and elevation range influence the extent and depth of flooding over time. These profiles demonstrate how AssetRx converts elevation maps into clear, time-based flood insights for each coastal zone.
1.Barefoot Beach & Naples Beach — The Uneven Shield
Barefoot Beach and Naples Beach represent the transitional terrain between Collier’s elevated dune ridges and low-lying coastal flats. Their mixed relief makes them ideal for examining how uneven topography concentrates early-stage flooding in small depressions while delaying its lateral spread. AssetRx captures these subtle gradients, showing how minor shifts in elevation create disproportionate differences in flood persistence.
| Year | Inundated Area (sq mi) | Mean Depth (m) | Dominant Depth Class | Max Depth (m) |
| 2030 | 1.54 | 0.12 | ≤ 0.4 | 0.73 |
| 2050 | 2.46 | 0.27 | ≤ 0.8 | 0.95 |
| 2090 | 3.84 | 0.91 | > 0.8 | 1.85 |
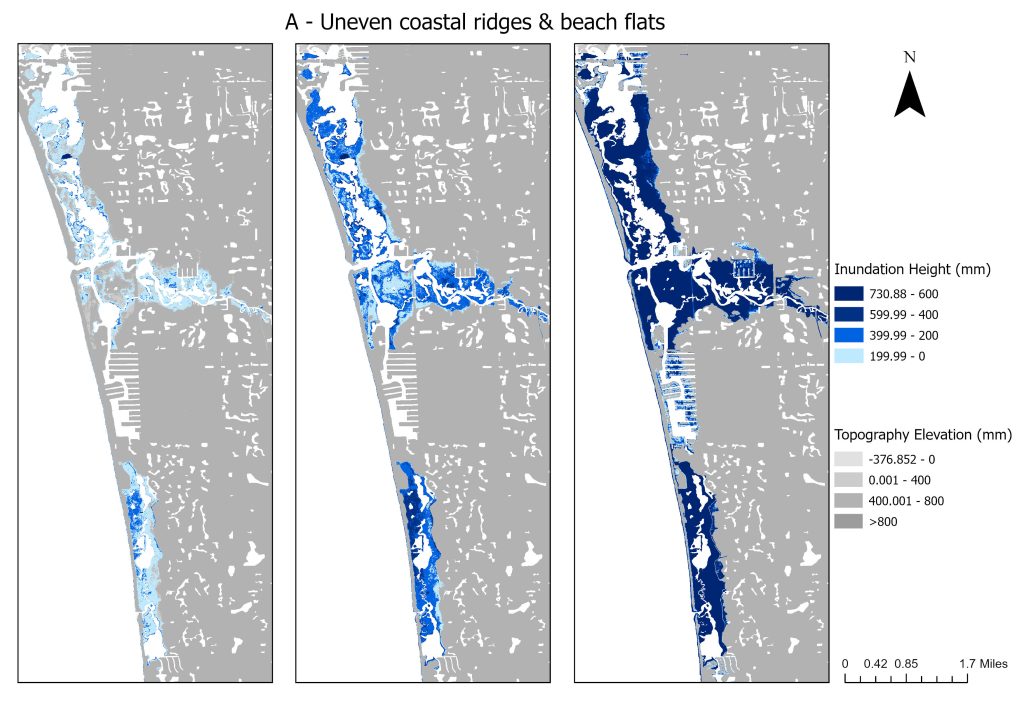
Fig.No. 2 Inundation height increases from 2030 to 2050 and exponentially rises by 2090 in the barefoot and Naple’s beach
Moderate elevation buffers early inundation, but depressions act as catchments, expanding gradually into connected basins. By 2090, >70 % of flooded zones exceed 0.8 m in depth — a transition from episodic to permanent flooding.
2. Aqua Lane Shores & Royal Harbor — Flat coastal plain
Aqua Lane Shores and Royal Harbor typify Collier County’s flat, canal-dominated shoreline, where engineered drainage and uniform elevation leave little natural defense. This area was selected to illustrate how even modest sea-level increases can translate into rapid, wide-area inundation. AssetRx’s granular modeling quantifies this horizontal expansion, revealing early spatial loss long before depths become severe.
| Year | Inundated Area (sq mi) | Mean Depth (m) | Dominant Depth Class | Max Depth (m) |
| 2030 | 7.22 | 0.13 | ≤ 0.4 | 0.73 |
| 2050 | 14.07 | 0.27 | ≤ 0.8 | 1.15 |
| 2090 | 23.81 | 0.90 | > 0.8 | 1.85 |
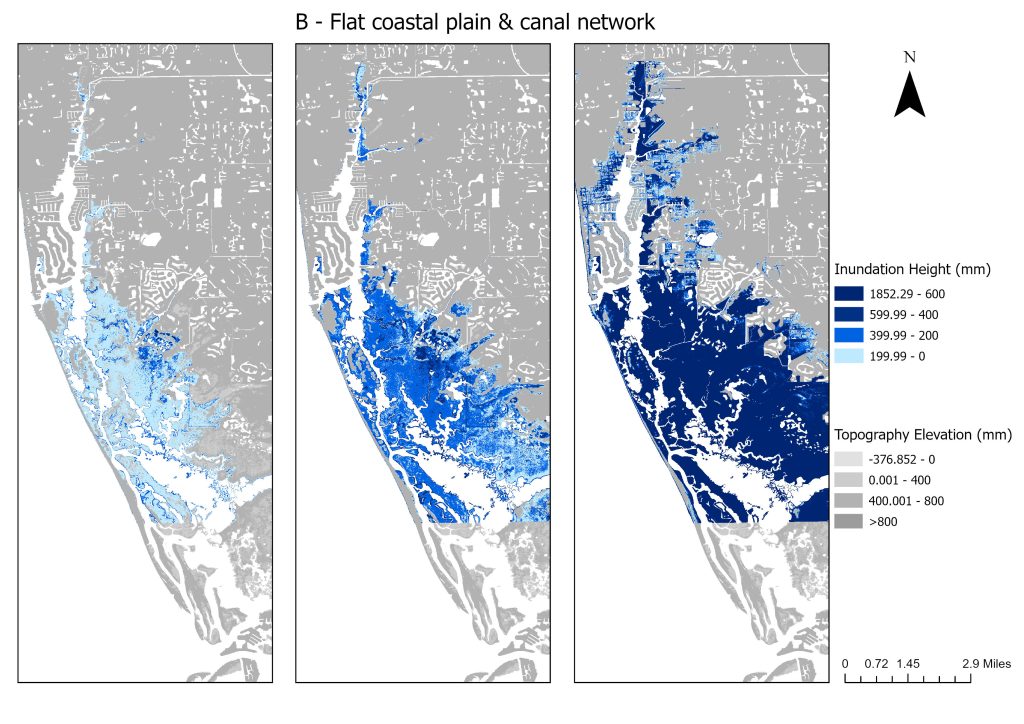
Fig.No. 3 Inundation height increases from 2030 to 2050 and vastly spreads by 2090 in the (B) Aqua Lane Shores & Royal Harbor
Flat, low-lying terrain allows rapid horizontal flood expansion. Between 2030 and 2050 the inundated area doubles, and by 2090 nearly 40 % of the region is below water. The gentle slope converts small sea-level increments into massive spatial loss a signature pattern easily captured and visualized by AssetRx’s raster-based analysis.
3. Marco Island — Low barrier island
Marco Island provides a clear picture of human-modified low-elevation landscapes and their sensitivity to sea-level change. Built largely on reclaimed land and intersected by canals, it responds almost instantly to minor sea-level fluctuations. AssetRx helps expose how engineered terrain amplifies exposure, turning shallow rises into measurable spatial transformation.
| Year | Inundated Area (sq mi) | Mean Depth (m) | Dominant Depth Class | Max Depth (m) |
| 2030 | 0.63 | 0.20 | ≤ 0.4 | 0.73 |
| 2050 | 1.32 | 0.29 | ≤ 0.8 | 0.95 |
| 2090 | 3.72 | 0.61 | > 0.8 | 1.85 |
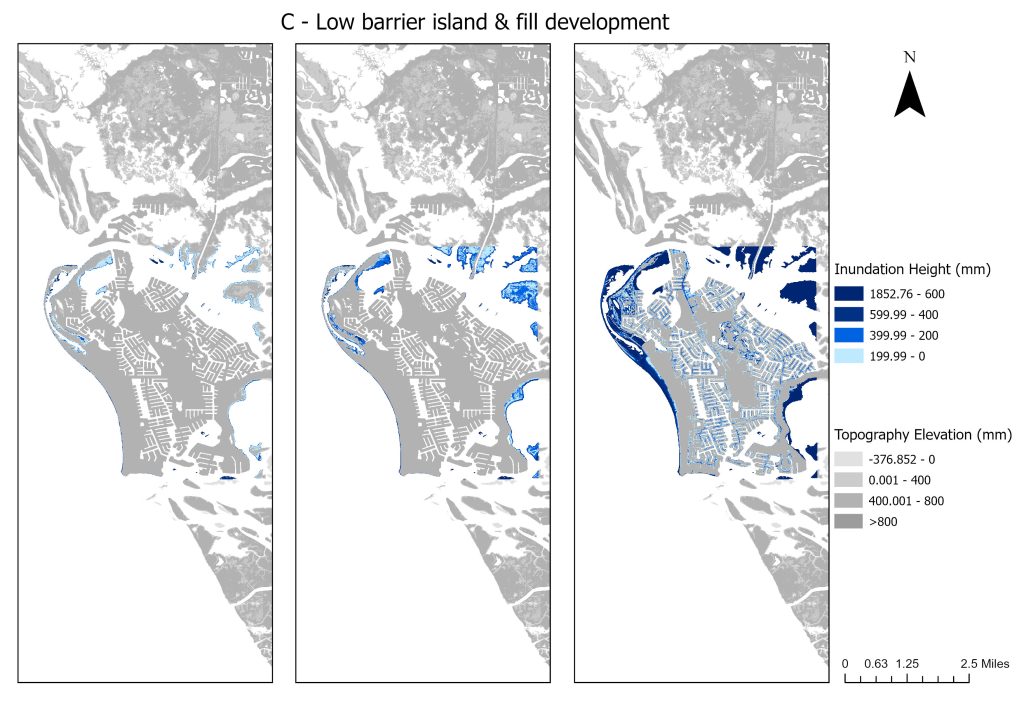
Fig.No. 4 Inundation height increases from 2030 to 2050 and vastly spreads by 2090 in residential area with a low inundation height in the Marco Island
Built on reclaimed land, Marco Island reacts almost immediately to sea-level change. The SLR area increases six-fold from 2030 to 2090 while mean depths remain modest, showing how subtle gradients amplify lateral flooding.
4. From Terrain to Transformation – Comparative Insights
The following comparison synthesizes insights from all three study areas, linking elevation profile with evolving SLR behavior. By examining changes in flooded area and average depth across time, we can visualize how each terrain type ridge, plain, and barrier responds differently to the same scenario. These aggregated metrics highlight the topography-driven contrasts in vulnerability that AssetRx makes visible at the county scale
| Metric (2090) | Barefoot Beach | Aqua Lane Shores | Marco Island |
| Mean Elevation (m) | 3.13 | 1.72 | 1.70 |
| Inundated Area (sq mi) | 3.84 | 23.81 | 3.72 |
| Mean Depth (m) | 0.91 | 0.90 | 0.61 |
| % Area > 0.8 m Depth | 72 % | 43 % | 41 % |
In 2090, Aqua Lane Shores shows the highest inundation extent (23.81 sq mi) with over 78% of its area submerged under <200 mm depth, reflecting widespread shallow flooding across its low-lying plain. Barefoot Beach, though smaller (3.84 sq mi), records deeper flooding—only 30% in the shallow bin and nearly 13% beyond 600 mm, aligning with its ridge-like elevation (3.13 m). Marco Island, dominated by 70% of area under <200 mm, exhibits limited but concentrated inundation (3.72 sq mi) with moderate depths (0.61 m). These variations confirm that elevation and slope gradients drive distinct inundation responses across the three coastal terrains.
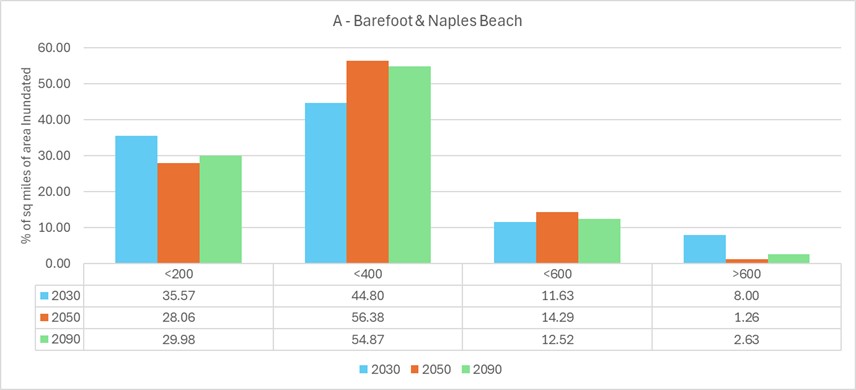
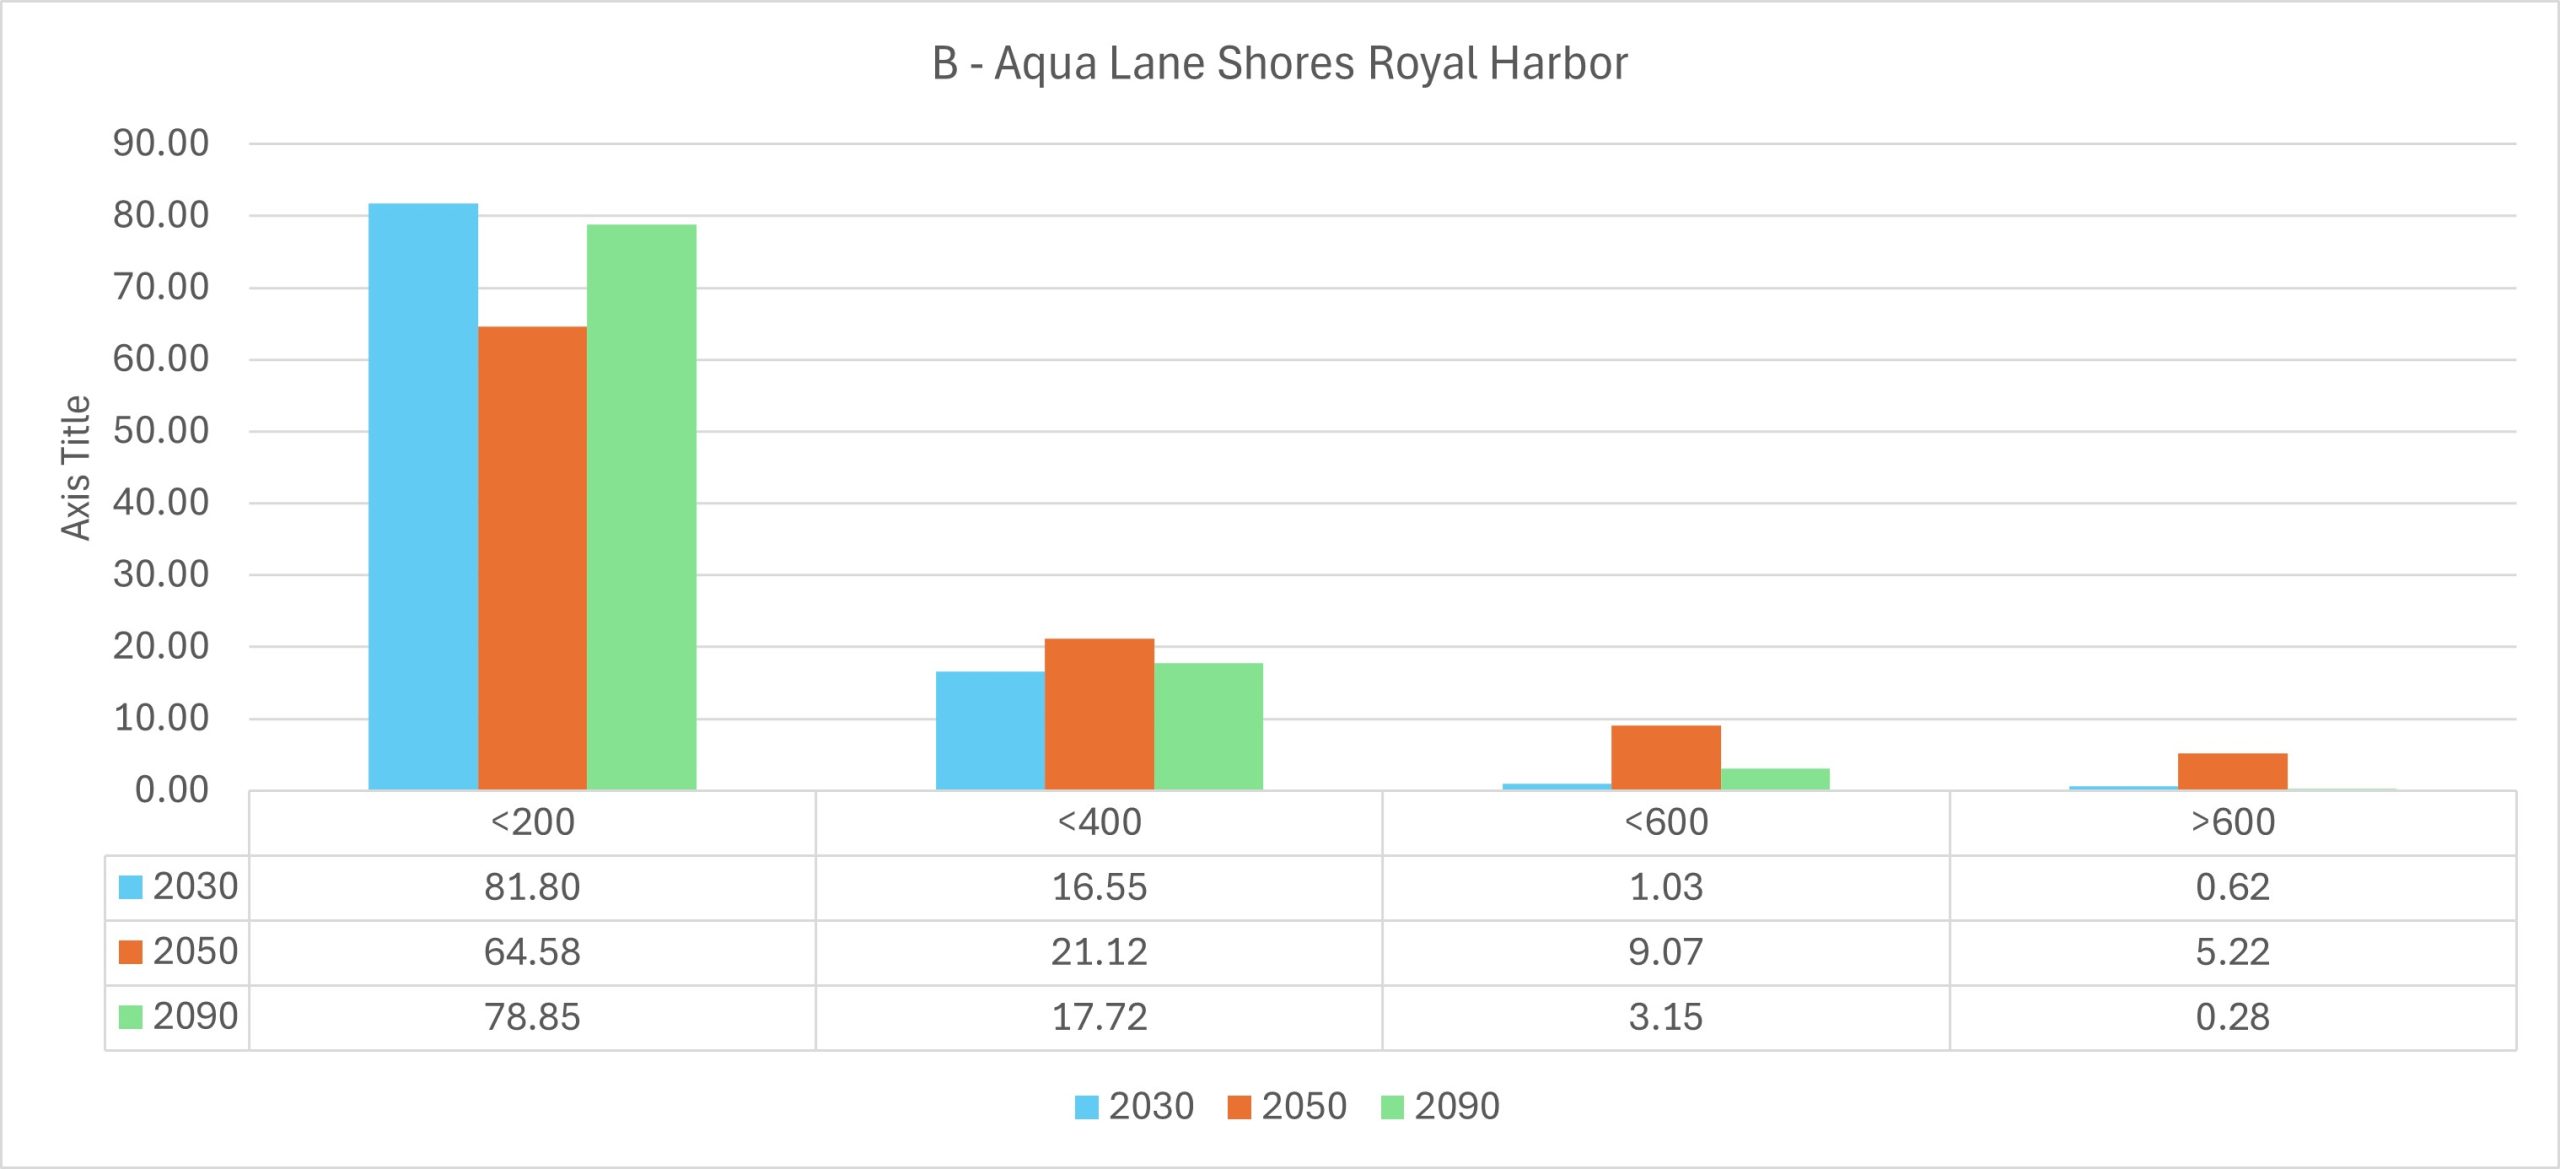
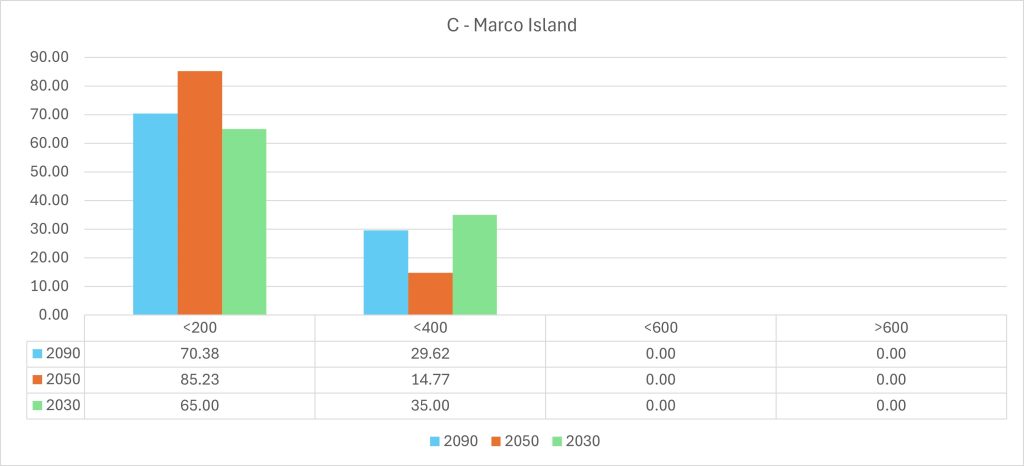
Fig. 5. Distribution of impacted area (sq miles) across inundation heights: <200mm, 200–400mm, 400–600mm, and >600mm.
- Elevation controls extent — every 1 m drop in mean elevation roughly triples inundation area.
- Slope controls intensity — uneven Barefoot Beach holds water in deeper pockets, while flat Aqua Lane spreads thin but wide.
- Barrier morphology accelerates onset — Marco Island shows earliest exposure at shallow depths.
5. Conclusion — AssetRx as the Enabler of Hidden Insights
This study demonstrates that topography is the lens through which sea-level rise becomes measurable and actionable.
By integrating DEM and SLR models, AssetRx exposes the hidden gradient between potential risk and actual impact:
- Converts raw elevation data into localized, year-by-year flood forecasts.
- Quantifies depth-based exposure—essential for insurers, municipalities, and infrastructure planners.
- Highlights micro-variations in resilience, invisible in conventional flood maps.
In Collier County, the difference between 1.7 m and 3.1 m in elevation defines whether land remains usable, adaptive, or lost. AssetRx translates that subtlety into foresight.