
Modeling Compound Climate Hazards: The Statistical Reality of Non-Stationary Flood Risk
Jun 11, 2026 @ 11:04
- by Premkumar SIn the domain of predictive climate modeling, the assumption of stationarity, the idea that natural systems fluctuate within an unchanging envelope of variability, has entirely broken down. Historically, coastal risk models have relied on univariate, deterministic projections of baseline Sea Level Rise (SLR). However, from a rigorous data science perspective, treating SLR in isolation introduces severe model underfitting and systematic negative bias in risk quantification.
The true statistical threat emerges from non-linear feature interactions. Specifically, when SLR acts as a compounding variable with extreme Annual Exceedance Probability (AEP) events (e.g., hurricane storm surges) and High Tide Flooding (HTF), the joint probability distribution of these hazards results in exponential impact scaling.
To quantify this, we executed a comparative analysis on high-resolution parcel-level datasets. By evaluating the Normalized Risk Score (NRS) and Indirect Impact (IDI) indices across 2040 and 2060 projections under Intermediate (I) and Intermediate-High (IH) emissions scenarios, we can mathematically deconstruct the architecture of compound vulnerability.
1. Analyzing Structural Exposure: Sea Level Rise (SLR) and Risk Distribution
Our initial exploratory data analysis focuses on the shifting Probability Density Functions (PDFs) of the Normalized Risk Score (NRS) across our building dataset. The NRS acts as our continuous target variable for physical structural exposure.
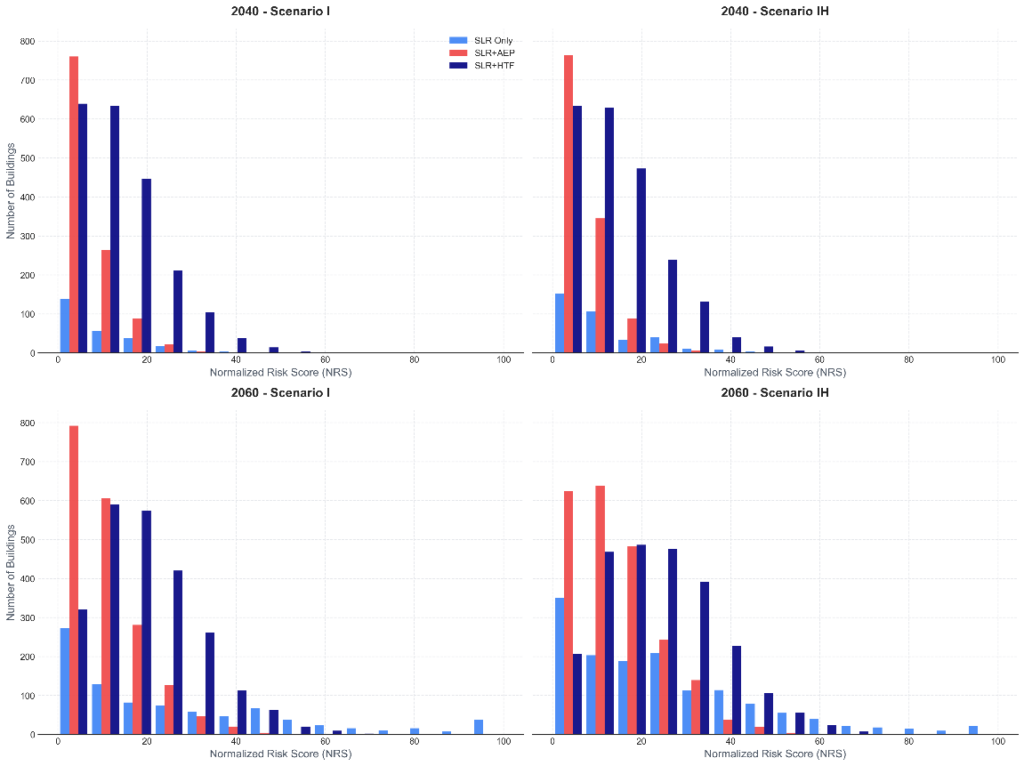
Insights & Distributional Variance:
The baseline SLR model demonstrates a high kurtosis and a heavily right-skewed distribution. The vast majority of the variance is strictly contained within the lowest deciles of the risk index. In this univariate model, the threat is characterized by low-variance, nuisance-level inundation.
However, introducing AEP and HTF as compounding variables forces a severe, non-linear distribution shift. The data no longer follows a gradual, predictable decay in the right tail. Instead, the probability mass shifts dramatically along the X-axis, filling the high-risk intervals.
Quantitatively, this proves that the relationship between water levels and structural risk is highly heteroscedastic. By 2060, under the Intermediate-High (IH) scenario, baseline SLR ceases to be the primary driver of damage; instead, it acts as an exponential multiplier of a raised baseline that fundamentally alters the probability density of severe risk scores when extreme weather events occur.
2. Modeling Extreme Weather: Annual Exceedance Probability (AEP) and Flood Thresholds
Beyond analyzing the intensity of the risk scores (the magnitude), we must evaluate the absolute scale of the affected sample size (the volume). This visualization tracks the absolute count of observations (individual structures) that cross the vulnerability threshold (defined as).
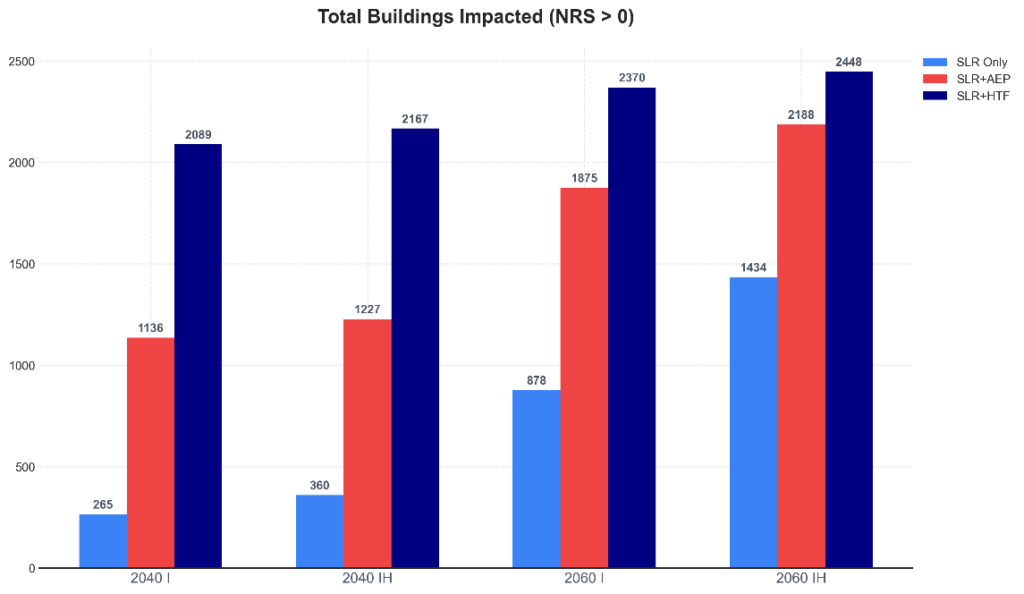
Insights & Step-Function Scaling:
This bar chart isolates what we term the “Surge Penalty,” the massive delta in observation counts between the baseline model and the compound hazard models.
The time-series progression of the SLR-only subset exhibits steady, linear scaling. However, the SLR+AEP dataset reveals explosive, step-function behaviour. Thousands of spatial data points that register as zero-risk outliers under the baseline SLR model instantly cross the exposure threshold when AEP is introduced.
From a spatial modeling perspective, this indicates that topographic boundary conditions are being catastrophically breached. The raised baseline water level allows the high-variance perturbation of a storm surge to bypass traditional coastal elevation defences, flooding entirely new geographic clusters that were previously deemed statistically safe. Relying solely on univariate SLR models systemically fails to capture this true spatial footprint.
3. Modeling Indirect Flood Impact: Network Theory and Supply Chain Disruption
To construct a robust, holistic risk framework, it is mathematically insufficient to measure only physical water depth. We must disaggregate our target variables into orthogonal vectors: Direct Impact (NRS – physical structural exposure) and Indirect Impact (IDI – systemic infrastructure disruption and network failure).
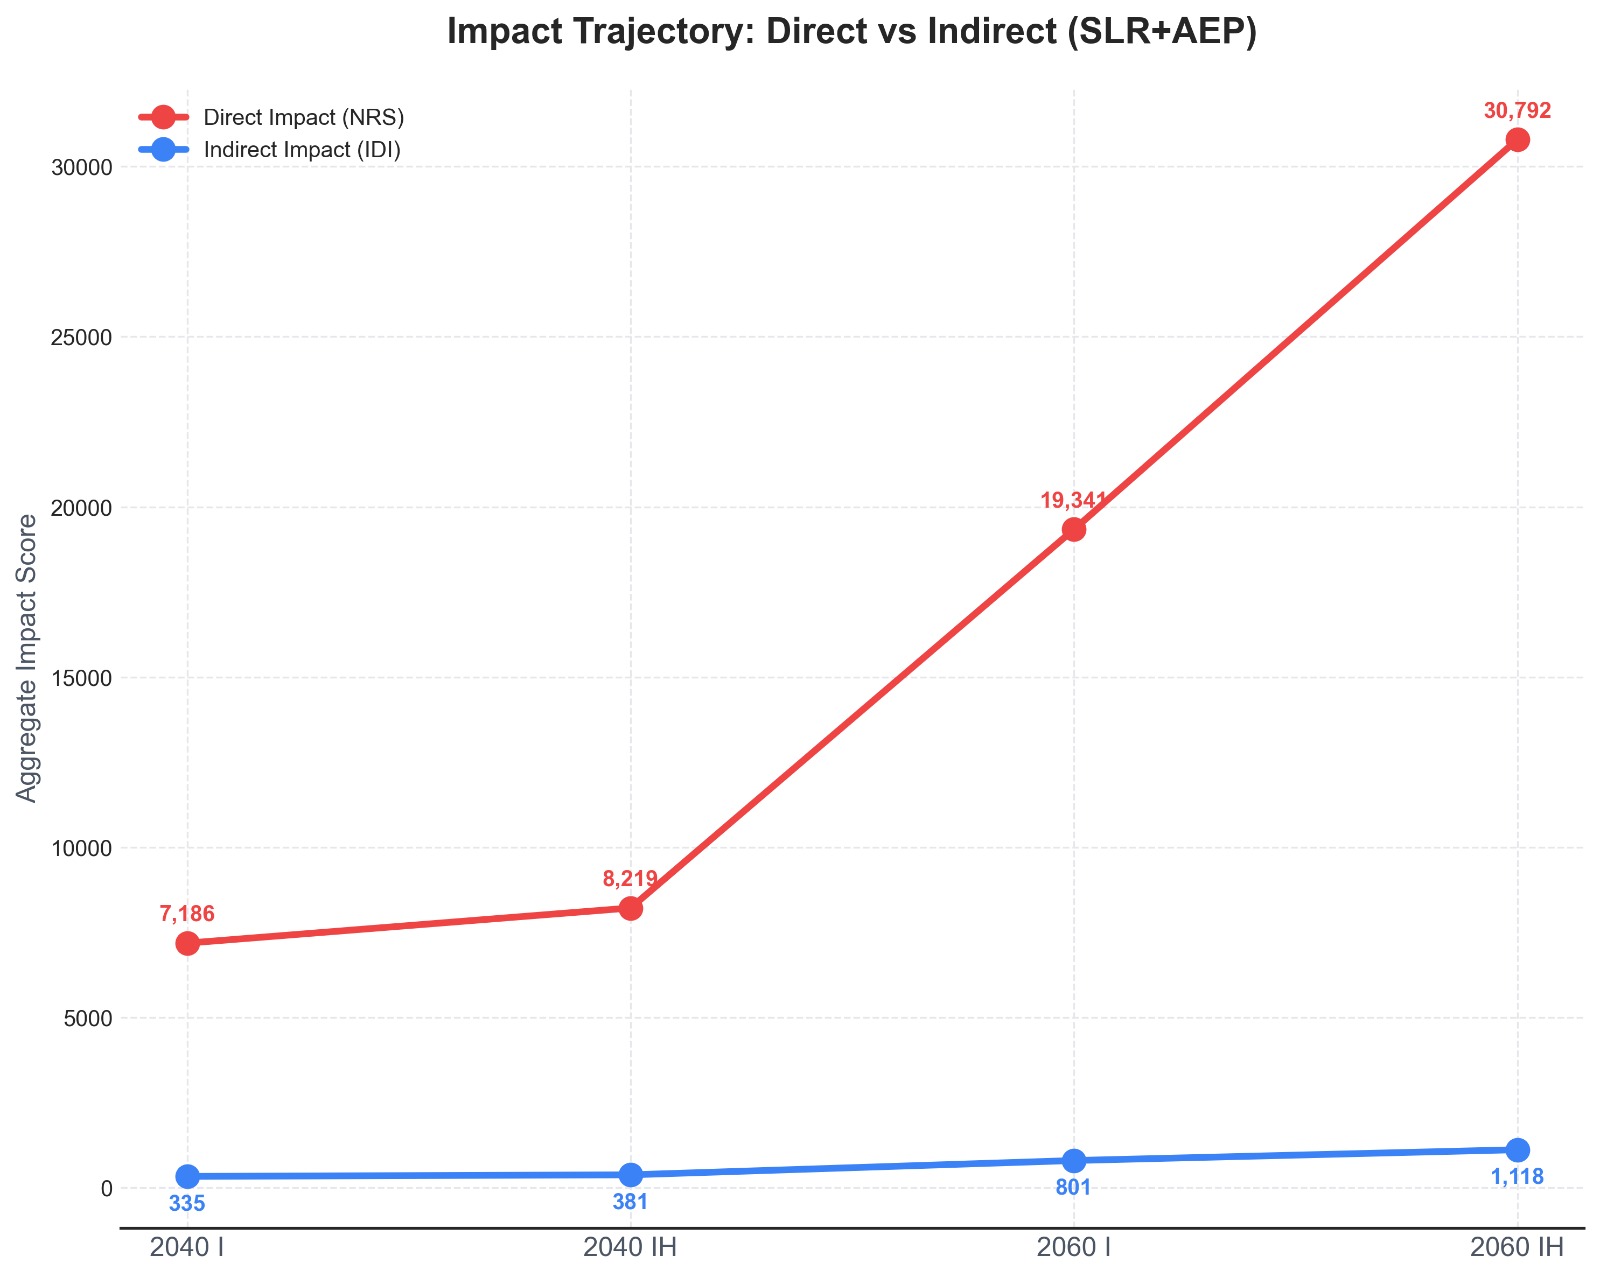
Insights & Network Theory:
This slope graph tracks the aggregate summation of NRS and IDI scores from 2040 to 2060, specifically isolating the worst-case SLR+AEP compounding hazard.
The most critical analytical takeaway is the scaling trajectory of the Indirect Impact vector. It scales at a highly elevated rate, running parallel to and effectively dominating the Direct Impact vector. Applying network theory to this data, we can deduce that while a specific node (a house) might avoid direct inundation, the edges connecting it (roads, power grids, supply chains) are failing rapidly.
Modeling solely for direct physical mitigation optimizes for the wrong loss function. The data definitively shows that cascading systemic failures and geographical isolation scale far more aggressively than direct physical damage, acting as the primary multiplier for economic loss.
Conclusion
The empirical evidence derived from this multivariate dataset is unequivocal. Univariate, static modeling of sea-level rise introduces dangerous negative bias, drastically underestimating future risk profiles.
The integration of compound hazard variables (HTF and AEP) results in immediate distribution shifts across the probability density function, triggers exponential scaling of the vulnerability footprint via threshold breaches, and exposes highly accelerated systemic network failures. To generate mathematically sound predictive models for urban infrastructure, data science and actuarial teams must discard isolated baseline models and transition exclusively to joint-probability, compounding risk frameworks.