
The Great Coastal Migration: A Deep Dive into Florida’s Residential Inundation Risk (2030–2090)
May 7, 2026 @ 13:32
- by Premkumar SFlorida’s coast is undergoing an invisible transformation. While the physical shoreline may still look the same today, the underlying flood data for residential buildings reveals a profound “migration” of risk. In this expert analysis, we explore the Perimeter Ratio (P-Ratio), a critical metric for structural integrity and insurability, to understand how thousands of homes are transitioning from safe “Low-range” baselines into critical “High- range” projections.
The Anatomy of the P-Ratio
To understand the data, we must first understand the P-Ratio (Perimeter Inundation Ratio). This is not just a measure of “how wet a yard gets.” It is a structural metric.
- Low Range (0–0.25): Water touches less than a quarter of the perimeter. This usually represents nuisance flooding or peripheral yard impact.
- Mid-Range (0.26–0.60): Water is now in contact with up to 60% of the building’s foundation. This introduces significant hydraulic pressure and potential basement or crawlspace compromise.
- High Range (0.61–1.0): At this level, the majority of the building is surrounded by water. This represents a “Tipping Point” where structural compromise and massive mitigation costs become nearly inevitable.
The Accelerating Trend
Our statewide analysis reveals that while the total number of buildings in the dataset remains constant, the classification of those buildings is shifting at an accelerating pace.
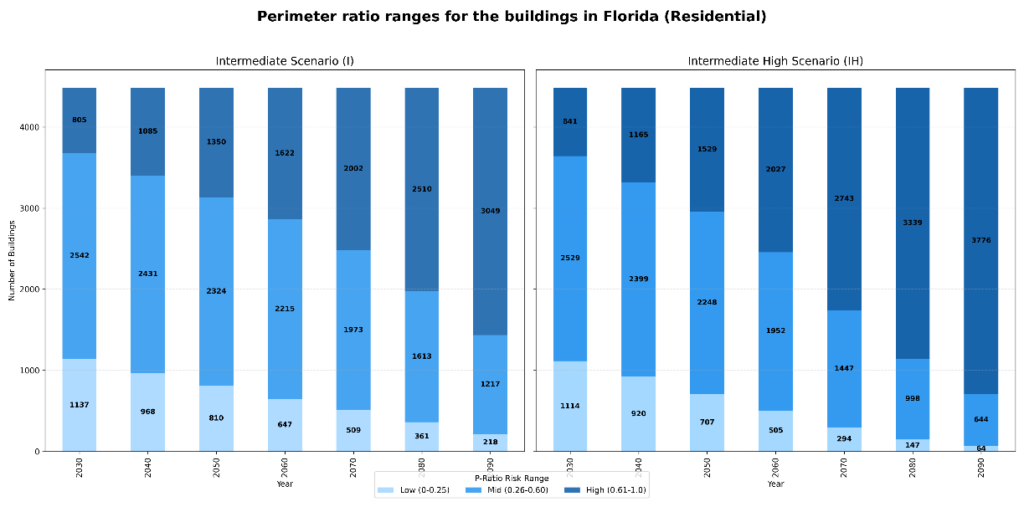
Graph 1: The population shift. Notice the “Dark Blue” High-Risk band expanding while the “Light Blue” safe zone is increasingly squeezed out by 2090.
The “Migration” Dynamics Flowing into the High-Risk Pool
A “Deeper” look at the data shows that risk is not static. Homes don’t simply “become” high-risk; they travel through a pipeline.
By tracking individual structures, we can see a “Flow of Vulnerability.” A substantial portion of the residential stock that is currently in the “Low” or “Mid” category is projected to move steadily into the “High” category. This is what we call the Coastal Risk Pipeline.
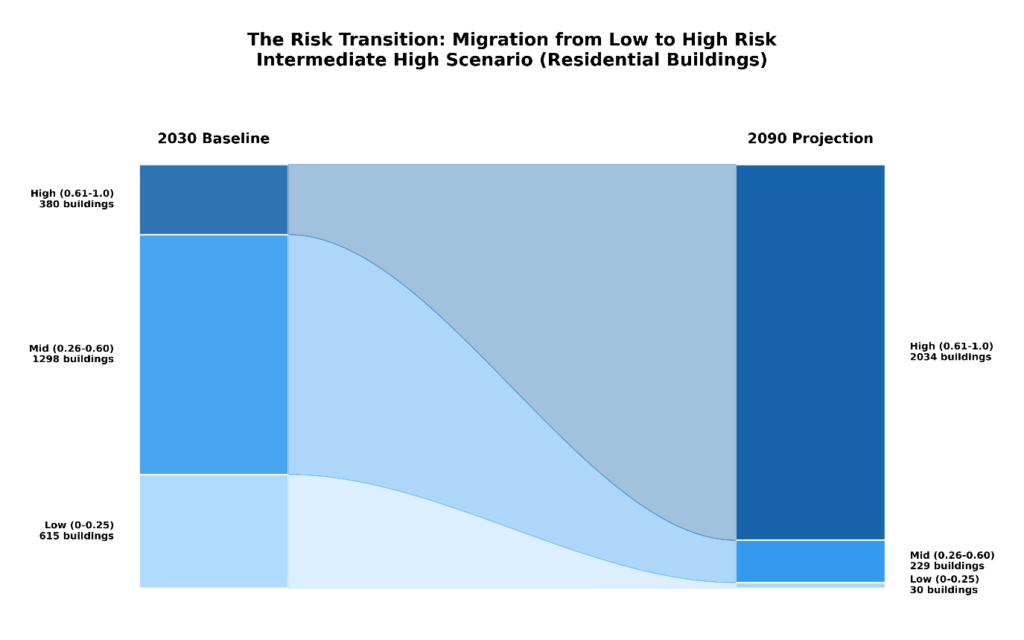
Graph 2: The “Connected Flow” diagram tracks how the 2030 building stock “migrates” into the 2090 projection. The widening dark blue band illustrates the “collecting” of buildings into the high-risk pool.
The Explosion of the “High-Risk” Population
One of the most startling, deeper insights is the compounding nature of the crisis. When we isolate just the “High Risk” category (P-Ratio > 0.60), we see that the growth isn’t linear; it’s explosive.
In the Intermediate High (IH) scenario, the number of high-risk buildings grows from a manageable ~800 in 2030 to a dominant ~3,776 by 2090. This represents a 348% increase in buildings that face severe foundation-level inundation.
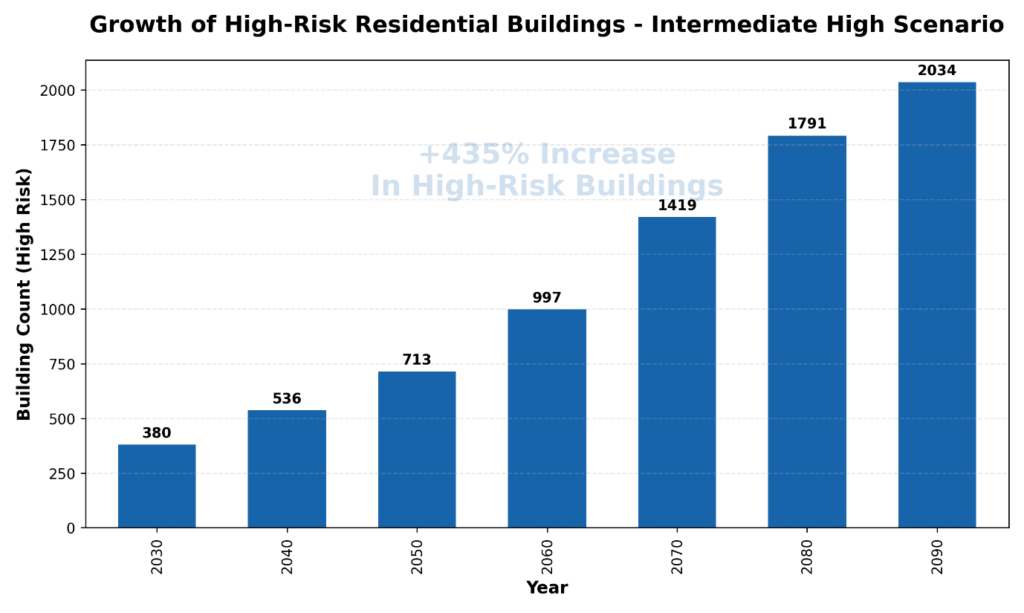
Graph 4: The non-linear growth of the High-Risk category. This chart removes the “noise” and focuses on the most critical threat to residential stability.
Geographic Divergence: The County “Heatmap”
When we look at “Statewide,” we see that Florida’s risk is not distributed evenly. There is a massive geographic divergence.
- Monroe County: Represents the “Zero Ground” for this transition, where the vast majority of the building stock enters the High-Risk category by mid-century.
- Citrus & Pinellas: These counties show a more “tiered” transition, with a significant “Mid-Range” population that eventually flips to High-Risk in the later decades.
Understanding the “All-County” view reveals which local economies are most at risk of losing their residential tax base due to chronic inundation.
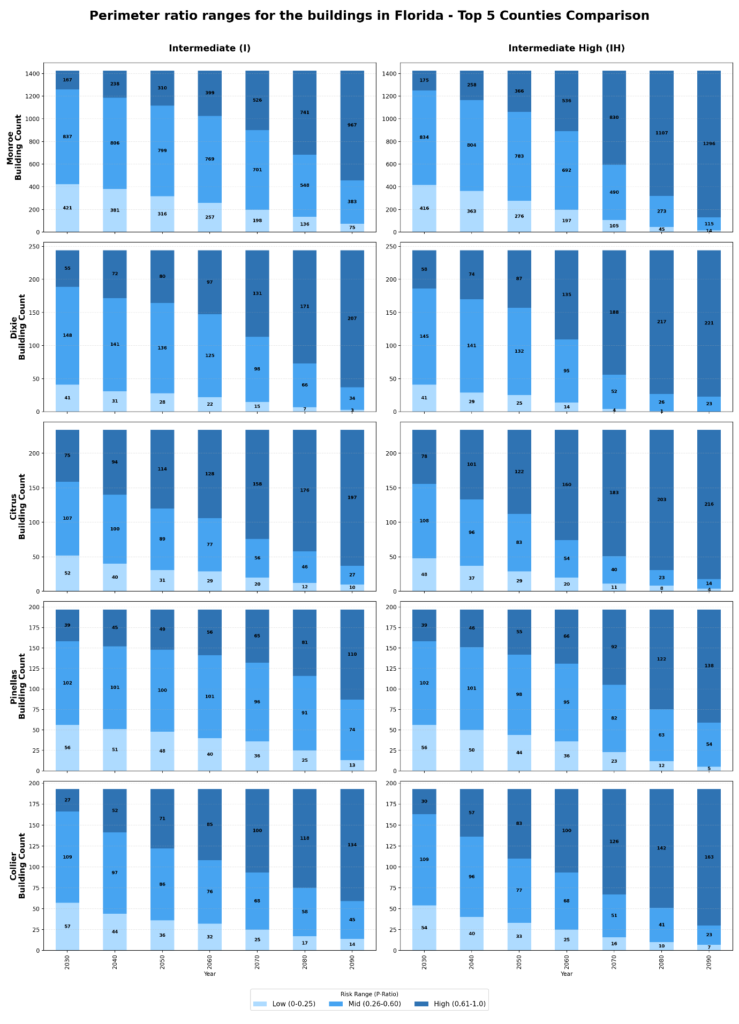
The “Gap of Uncertainty” Scenario I vs. IH
The deepest insight for planners lies in the “Delta” (the gap) between the Intermediate (I) and Intermediate-High (IH) scenarios.
For the “Low-Risk” category, the two scenarios track relatively closely. However, in the High-Risk category, they diverge sharply after 2060. This gap represents the “Uncertainty Premium”, the range of outcomes that planners must account for. Designing for Scenario I while Scenario IH occurs would leave thousands of buildings critically unprotected.
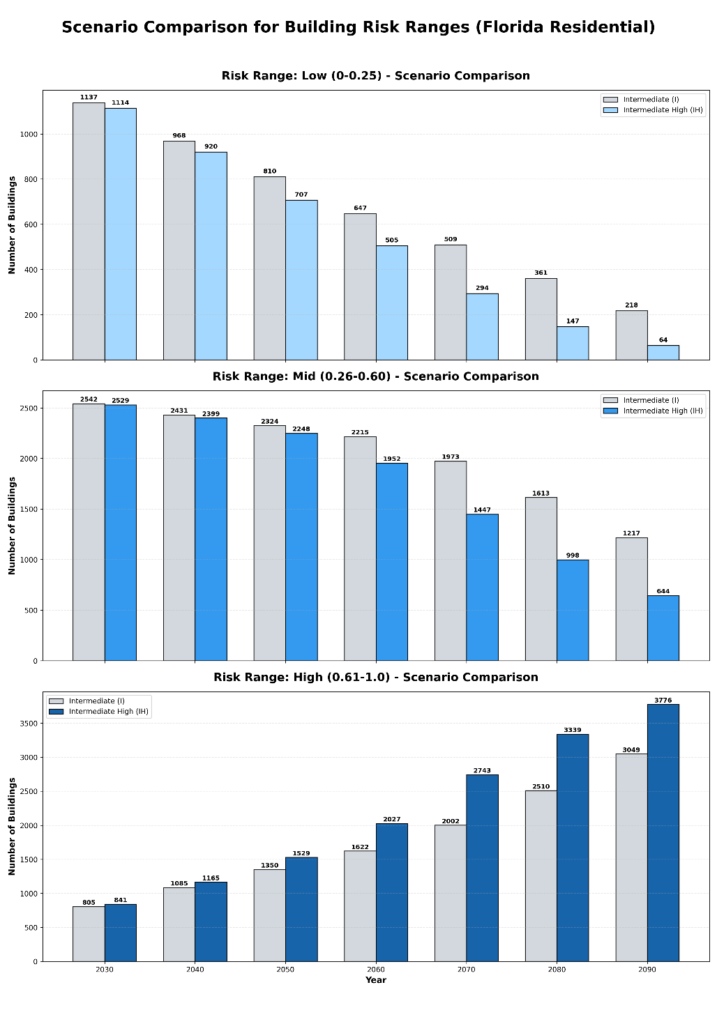
Graph 5: A deep-dive comparison of two future paths. The bottom panel shows the widening “scissors” between the two scenarios in the High-Risk category.
From Data to Decision
The transition of Florida’s residential buildings from 0.0 to 1.0 P-Ratio is not a future possibility; it is a current trajectory. The data suggests that we are moving from a state of “localized nuisance” to “systemic structural exposure.” For real estate, insurance, and municipal planning, the message is clear: the most critical work will be managing the “Migration of Risk” that is already underway.
Conclusion: The Underwriting Mandate for the Coastal Risk Pipeline
The transition of Florida’s residential buildings from a 0.0 to a 1.0 P-Ratio is not a future possibility; it is a current trajectory. We are rapidly moving from an era of localized nuisance flooding to one of systemic structural exposure.
For insurance carriers, actuaries, and Chief Risk Officers, the challenge is no longer just acknowledging the water; it is actively managing the migration of risk within your book of business. You cannot successfully protect your loss ratio or justify rate filings using static data for a dynamic threat.
Future-proofing a portfolio requires moving beyond regional averages to find the ground-up truth of every individual structure. By utilizing high-resolution models to track exactly when an asset will slide down the Coastal Risk Pipeline, carriers can shift from blind market exits to surgical underwriting. This is the only way to confidently capture the low-risk “topographic islands” while pruning the liabilities from your portfolio before they trigger catastrophic claims.