
The Dry Island Paradox: Uncovering Non-Linear Anomalies in Neighborhood Risk Scores (NRS)
Jul 27, 2026 @ 11:05
- by Premkumar SIn traditional climate risk modeling, stakeholders often default to a linear assumption: x inches of sea-level rise (SLR) equates to y dollars in localized damage. However, deep cross-data analysis of the Florida buildings dataset specifically tracking the Neighborhood Risk Score (NRS) and its dispersion (NRSD) across multiple decades and NOAA SLR scenarios reveals that climate risk behaves in highly abnormal, non-linear ways. By isolating Miami-Dade County (FIPS 12086) as a primary test bed, our latest modeling reveals compounding systemic vulnerabilities that traditional direct-impact models completely fail to capture.
2. The ‘Dry Island’ Paradox: When Indirect Risk Impact Exceeds Direct Risk Impact
One of the most striking anomalies observed in the data is the drastic divergence between Direct Risk Impact (DRI) and Indirect Risk Impact (IDI). When analyzing specific census tracts (e.g., Tract T1208600072 in Miami-Dade) under the 2090 Intermediate High (IH) scenario, we see an unusual behavioral split. The Direct Risk Impact to buildings remains practically zero (DRI ~0.07), meaning the physical assets themselves are situated at high enough elevations to remain dry. However, the Indirect Risk Impact (IDI) skyrockets to 0.535.
This creates what we call the ‘Dry Island’ Paradox. The building is physically untouched by floodwaters, yet its overall Neighborhood Risk Score is catastrophic because the local access roads have succumbed to tidal inundation. This proves that risk algorithms relying solely on parcel elevation will fundamentally misprice long-term asset viability by ignoring the critical road impact metric.
| Census Tract (Miami-Dade) | Direct Risk Impact (DRI, 2090 IH) | Indirect Risk Impact – Roads (IDI, 2090 IH) | Combined NRS (2090 IH) |
| T1208600072 | 0.0700 | 0.5353 | High |
3. Occupancy Vulnerability Inversion and NRSD Fracturing
A comparative analysis across occupancy classes uncovers a chronological vulnerability inversion. In the near-term (2030, Intermediate scenario), Community Lifelines such as Education and Assembly buildings exhibit abnormally high initial vulnerability, posting NRS values around 0.55, nearly triple the risk of standard Residential assets (0.18). This reflects historical civic zoning practices heavily favoring coastal or low-lying accessible plains.
Yet, as the timeline extends to 2090 (IH), the dynamic shifts entirely. While the absolute risk rises across all sectors, the (NRS) for Residential assets explodes, reaching a staggering variance index of 12.67. This statistical fracturing indicates that the housing market does not degrade uniformly. Instead, localized micro-topography dictates outcomes, leading to highly unequal risk distribution where adjacent residential blocks experience wildly different fates—some entirely written off, while others remain heavily gentrified ‘high-ground’ enclaves.
| Occupancy Class | NRS (2030, Intermediate) | NRS Dispersion (NRS, 2090 IH) | Risk Profile Status |
| Education | 0.55 | 10.39 | Early Vulnerability |
| Assembly | 0.52 | 11.69 | Early Vulnerability |
| Residential | 0.18 | 12.67 | High Long-Term Fracturing |
| Industrial | 0.10 | 1.94 | Stable/Low Dispersion |
4. The Scenario Paradox: When Intermediate Risk Outpaces Intermediate-High
Perhaps the most abnormal statistical behavior discovered from our data is the Scenario Paradox. Logic dictates that a more severe climate scenario should universally generate a higher risk score. Yet, our cross-data analysis isolated 121 specific assets in Miami-Dade where the 2050 Intermediate (I) scenario generated a higher NRS than the more severe Intermediate High (IH) scenario.
How is this mathematically and physically possible? This anomaly is driven by state-transition modeling. In the severe IH scenario, these specific assets rapidly cross the threshold into permanent inundation by 2050, triggering an early ‘abandonment’ state in the model where repetitive risk stops compounding. Conversely, the less severe Intermediate scenario subjects these same assets to protracted, repetitive tidal flooding. The mathematical compounding of this chronic, ongoing disruption actually drives the Neighborhood Risk Score higher than an abrupt total loss. This out-of-the-box behavior perfectly highlights why temporal dynamics and systemic stress testing are paramount in modern climate risk analytics.
5. Conclusion
The granular analysis of NRS metrics clearly demonstrates that climate risk cannot be mapped via simple elevation thresholds. The emergence of Dry Islands, market fracturing via high dispersion, and paradoxical scenario inversions require data scientists to adopt graph-based, systemic approaches to risk modeling. As we move deeper into the century, understanding these non-linear anomalies will be the defining factor in accurate asset valuation and urban resilience planning. Request your free demo from AssetRX and get started.
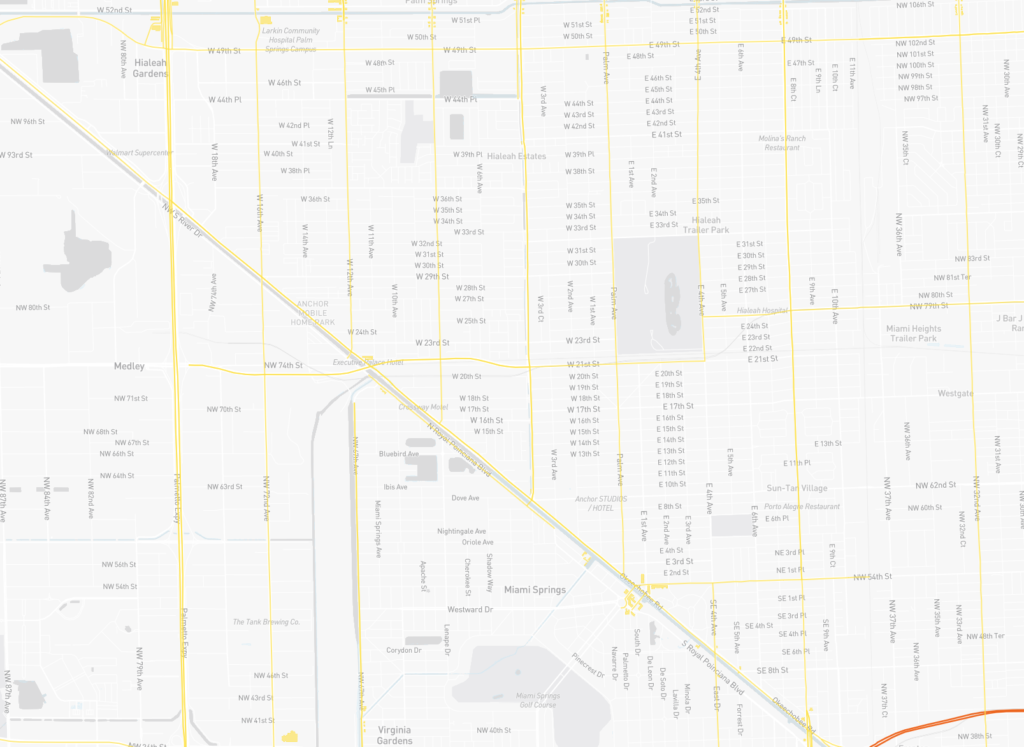
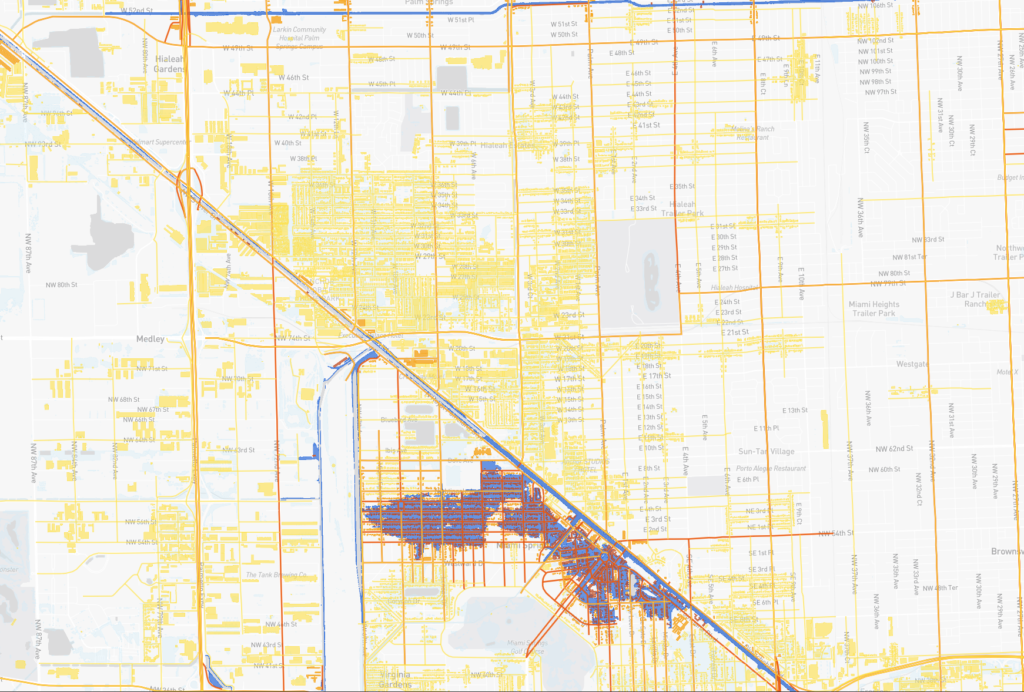
Fig.No.1 Comparison of flood risk impacts. While the physical buildings face virtually no direct threat due to high elevation (DRI ~0.07), the indirect risk impact spikes significantly to a high of 0.535. Left side: 2030 Intermediate and right side: 2090 Intermediate High.